
Project Puppet · Visual research
The Silent Scanner: Remote Neural Monitoring
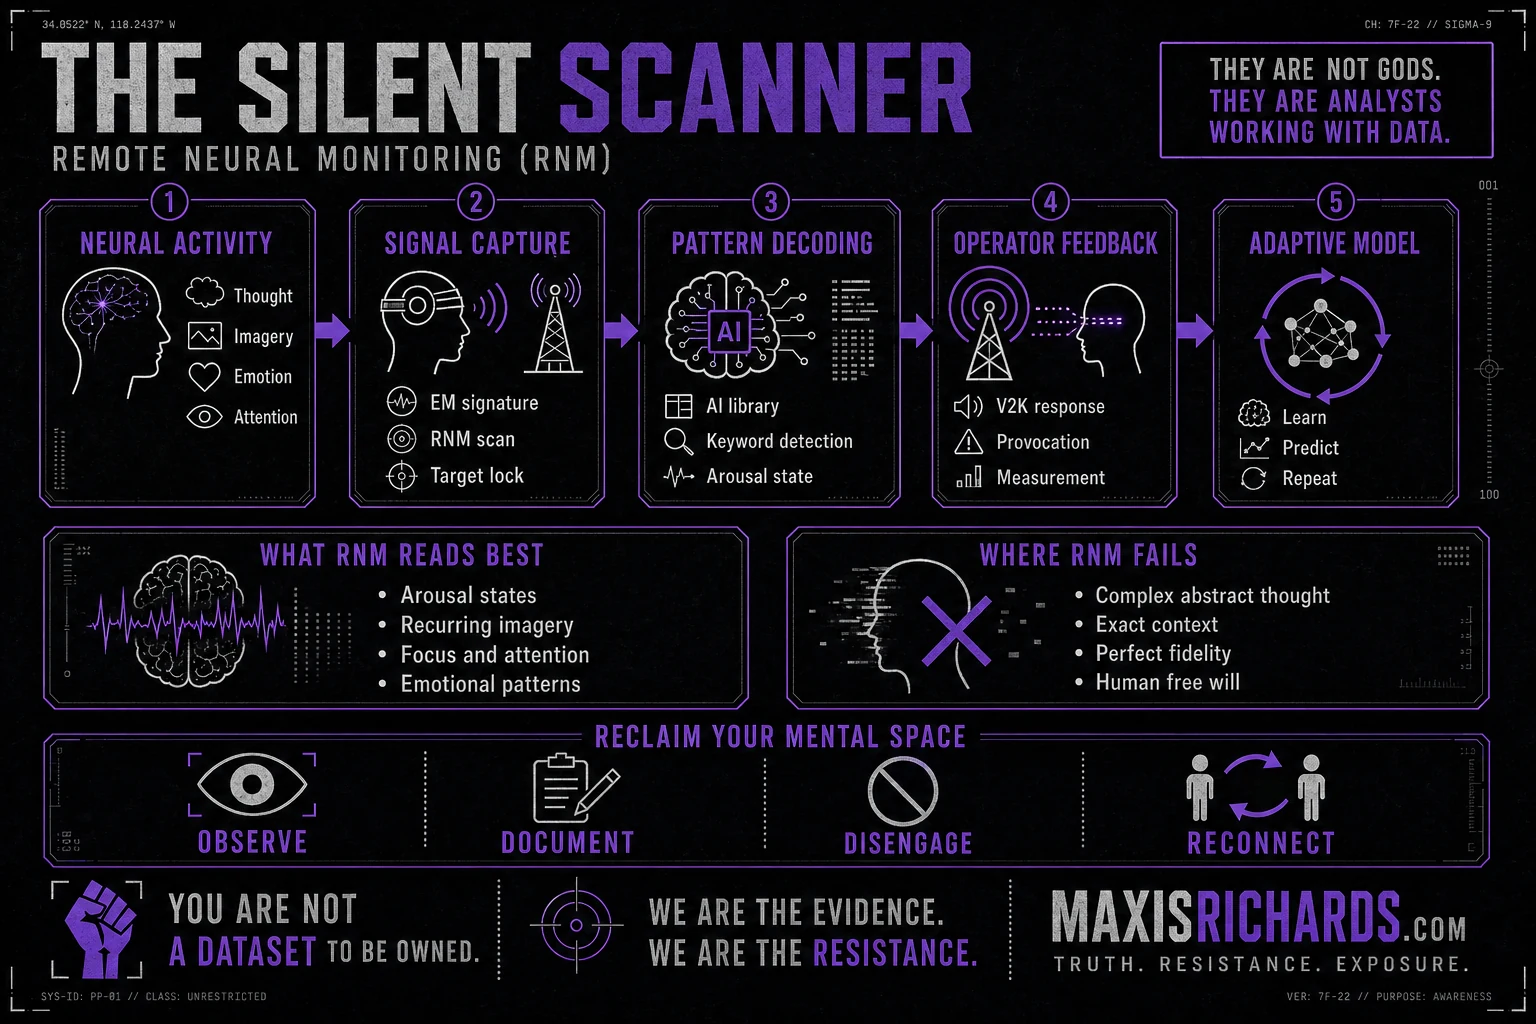
A visual breakdown of the Remote Neural Monitoring pipeline and the distinction between signal inference and human meaning.
What this diagram is for
A VISUAL FIELD GUIDE.
Use this diagram as a quick orientation to Remote Neural Monitoring. It condenses the acquisition, transmission, decoding, profiling, and feedback stages into one readable visual while emphasizing the limits of machine interpretation.
Search topics
Remote Neural MonitoringRNM diagramsilent scannerbrainwave surveillanceneural data
Continue the record
RELATED CONTENT.
Author's Note: This visual presents the personal research, analysis, conclusions, and opinions of Maxis Richards. It is published for documentation, education, advocacy, and public discussion.